Browse By People
Learn how to use the network visualization tool
Why visualize people as a network?
A network graph is a visual representation of the interconnections between many entities.
When it comes to relationships between individuals, we often think of direct relationships: friendships, collaborations, romances. But individuals are also richly interconnected through mutual acquaintances, through cities, and through cafés.
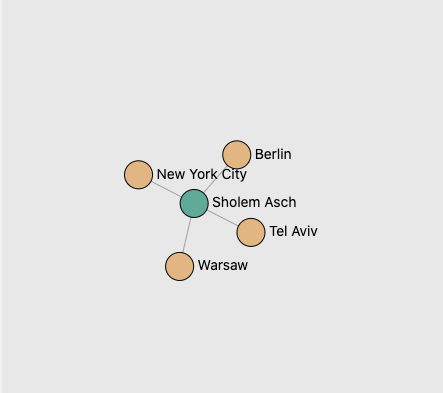
Let's take the example of Sholem Asch, the Yiddish novelist and playwright. Here he is shown as a circle or node.
Sholem Asch lived and worked in Warsaw, Berlin, New York City, and Tel Aviv, where he published stories in Yiddish and Hebrew and had his plays staged in a variety of languages. Asch also mingled with other Jewish writers in the cafés of each city he lived in.

We now have five entities: four cities and one person.
To show Asch is associated with each cities, we use lines. In this case, each city connects with Asch, whose node appears in the center of the graph. These connecting lines are called edges in network graphs.
Kotik's Café was a popular café in Warsaw. We've added the café to our graph as a light grey node.
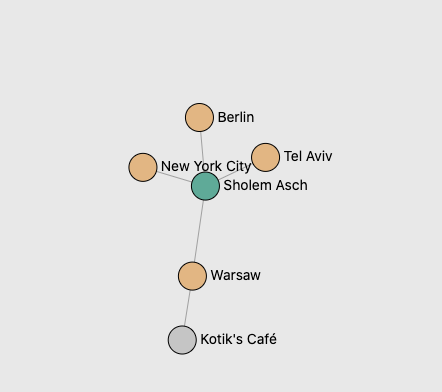
One café that the young Sholem Asch frequented during his stay in Warsaw was Kotik’s, a small and affordable café which attracted many Jewish writers, intellectuals, and activists. We know that Asch would often take coffee in Kotik’s with his friend and fellow writer, Avrom Reyzen.
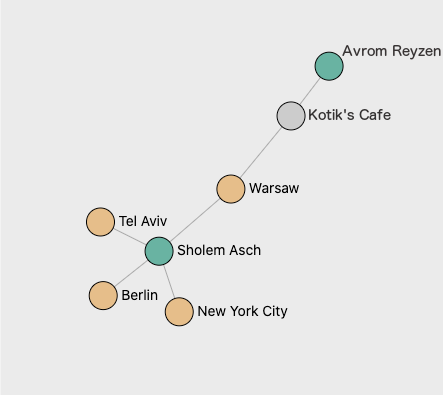
Take a look at the graph. We can now trace the connection between Asch and Reyzen through two nodes: Warsaw and Kotik's.
The encounter between Asch and Reyzen represents only one of countless pathways of immigration, conversation, and happenstance that connected Jewish cafés across the world.
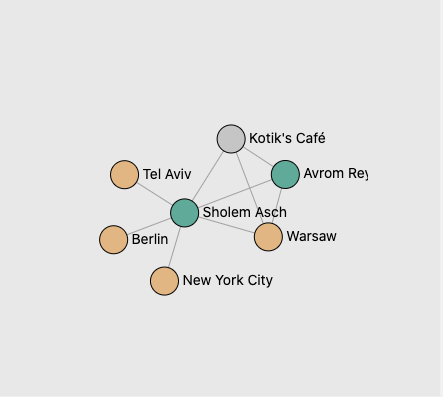
Once we realize that Asch, Reyzen, Warsaw, and Kotik's are all connected, our understanding of relationships between café-goers becomes much more complex! The purpose of a network graph is to allow you to investigate specific pathways, as well as see big-picture patterns across hundreds of entities.